
))
Cannabis, Cheech, and Chong
Manage episode 416402685 series 2805499
محتوای ارائه شده توسط Mean, Median, and Moose. تمام محتوای پادکست شامل قسمتها، گرافیکها و توضیحات پادکست مستقیماً توسط Mean, Median, and Moose یا شریک پلتفرم پادکست آنها آپلود و ارائه میشوند. اگر فکر میکنید شخصی بدون اجازه شما از اثر دارای حق نسخهبرداری شما استفاده میکند، میتوانید روندی که در اینجا شرح داده شده است را دنبال کنید.https://fa.player.fm/legal
This month on Mean, Median, and Moose, we look at Canadian data on Cannabis.
Statistics Canada Infographics
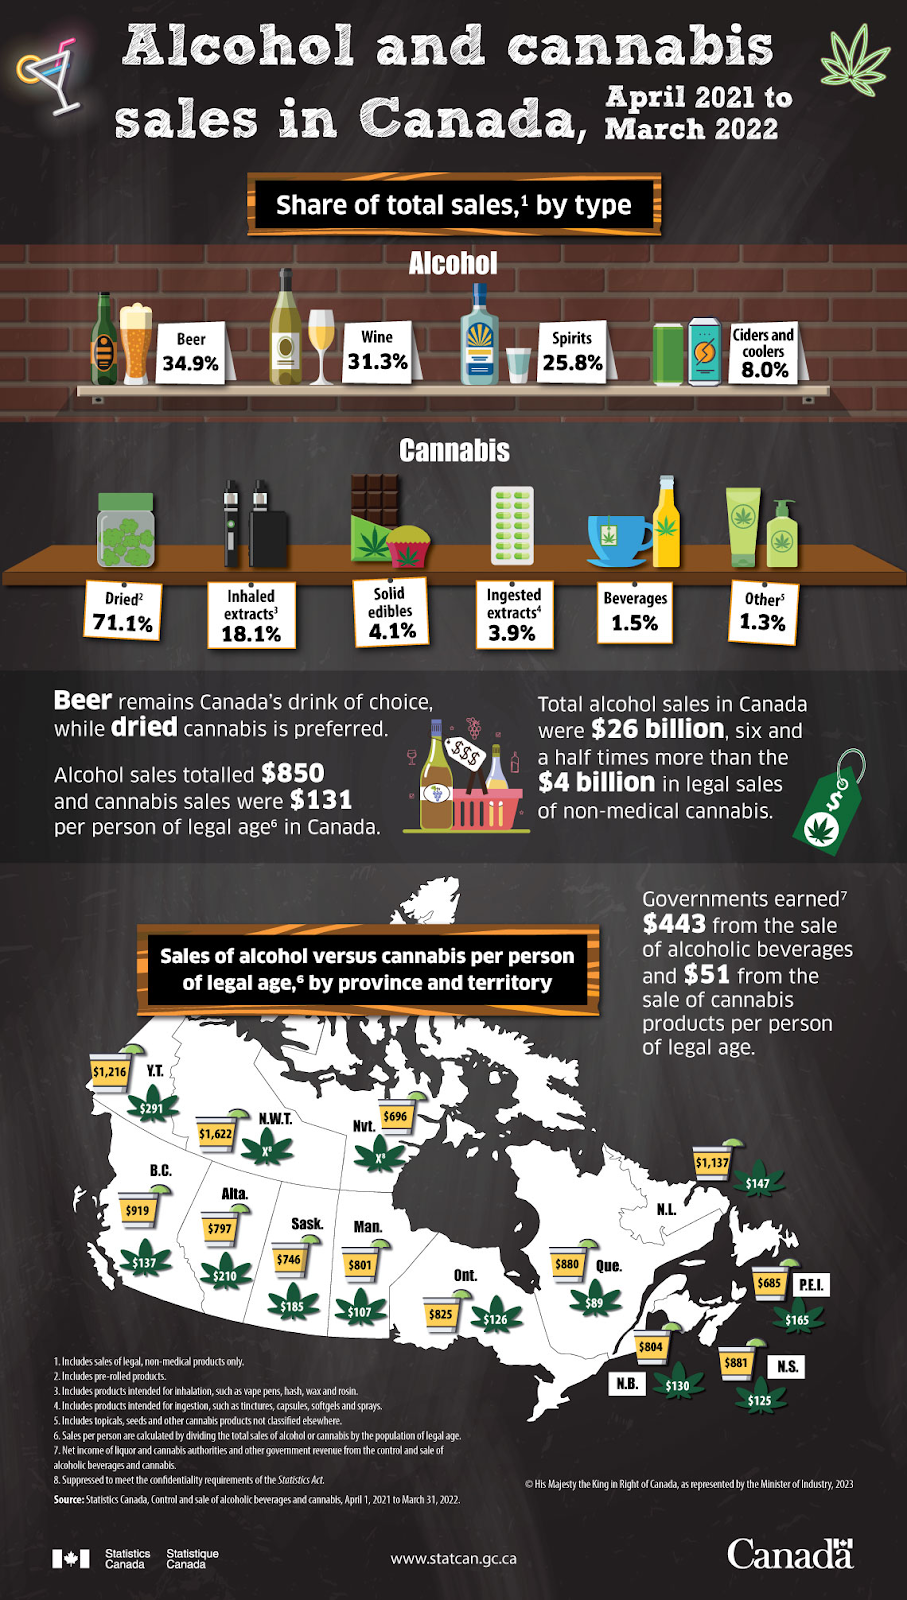
I was a little behind this month so I dug into a couple of different data sets. First I looked up what infographics were available from Statistics Canada. From fall 2023 there was a graphic that compared booze to pot sales in Canada from 2021-2022.
An archived graphic from 2021 showed how legalization scaled up cannabis
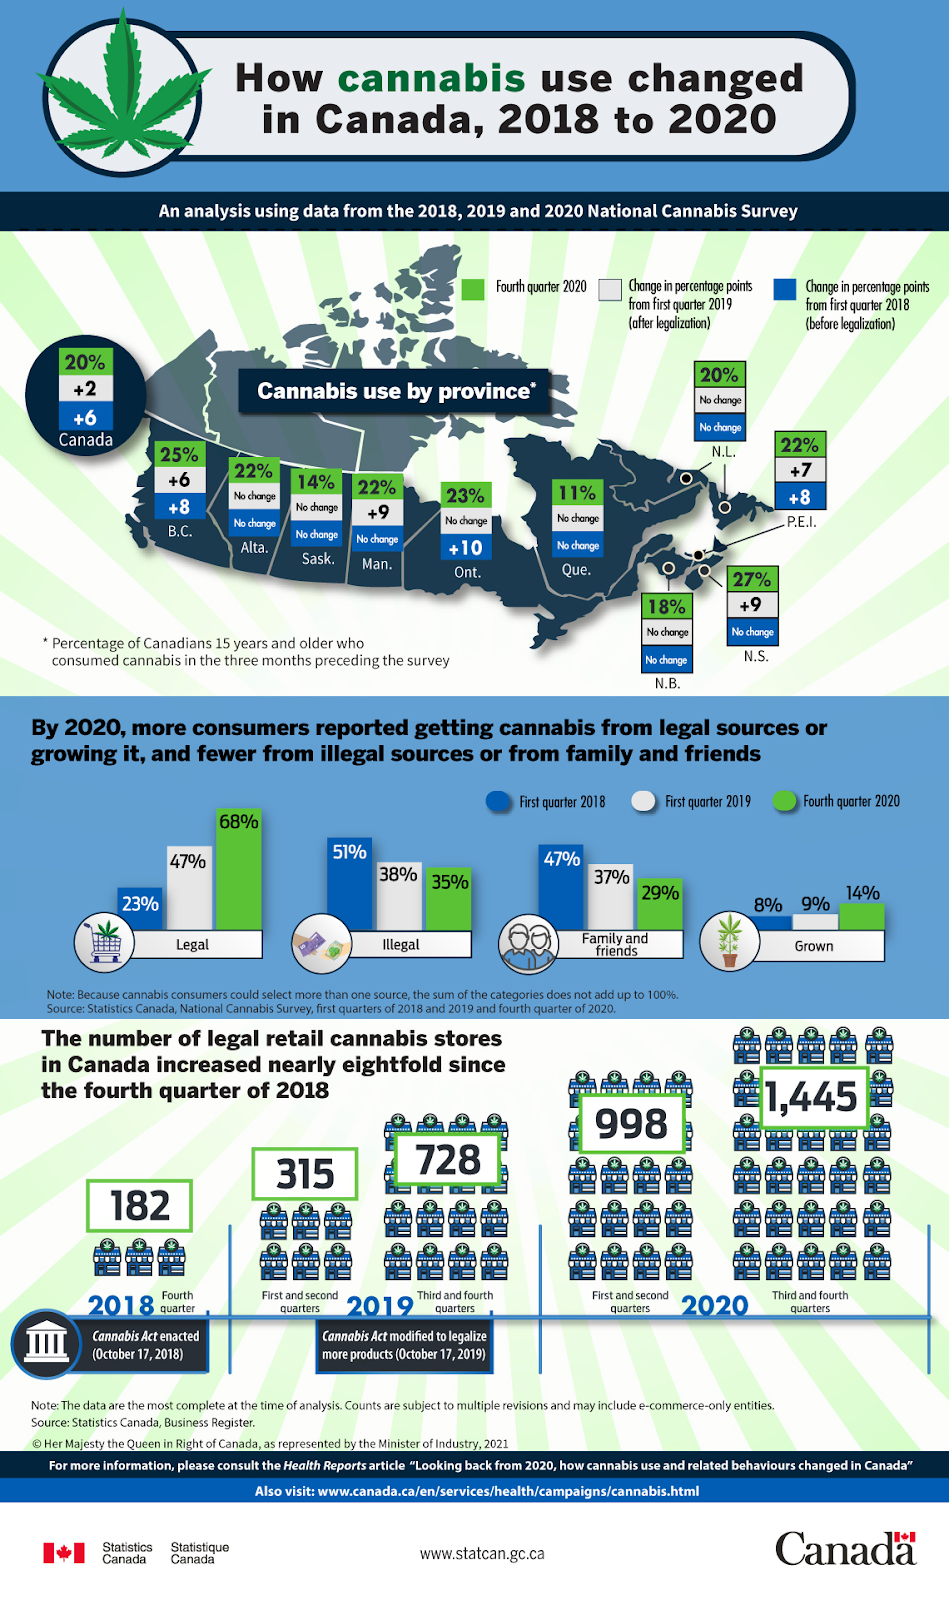
These are the only two infographics from Statistics CAnada that I could find, there other government of Canada infographics related to cannabis – like this one for legal risk from Health Canada; impaired driving, boating, flying;
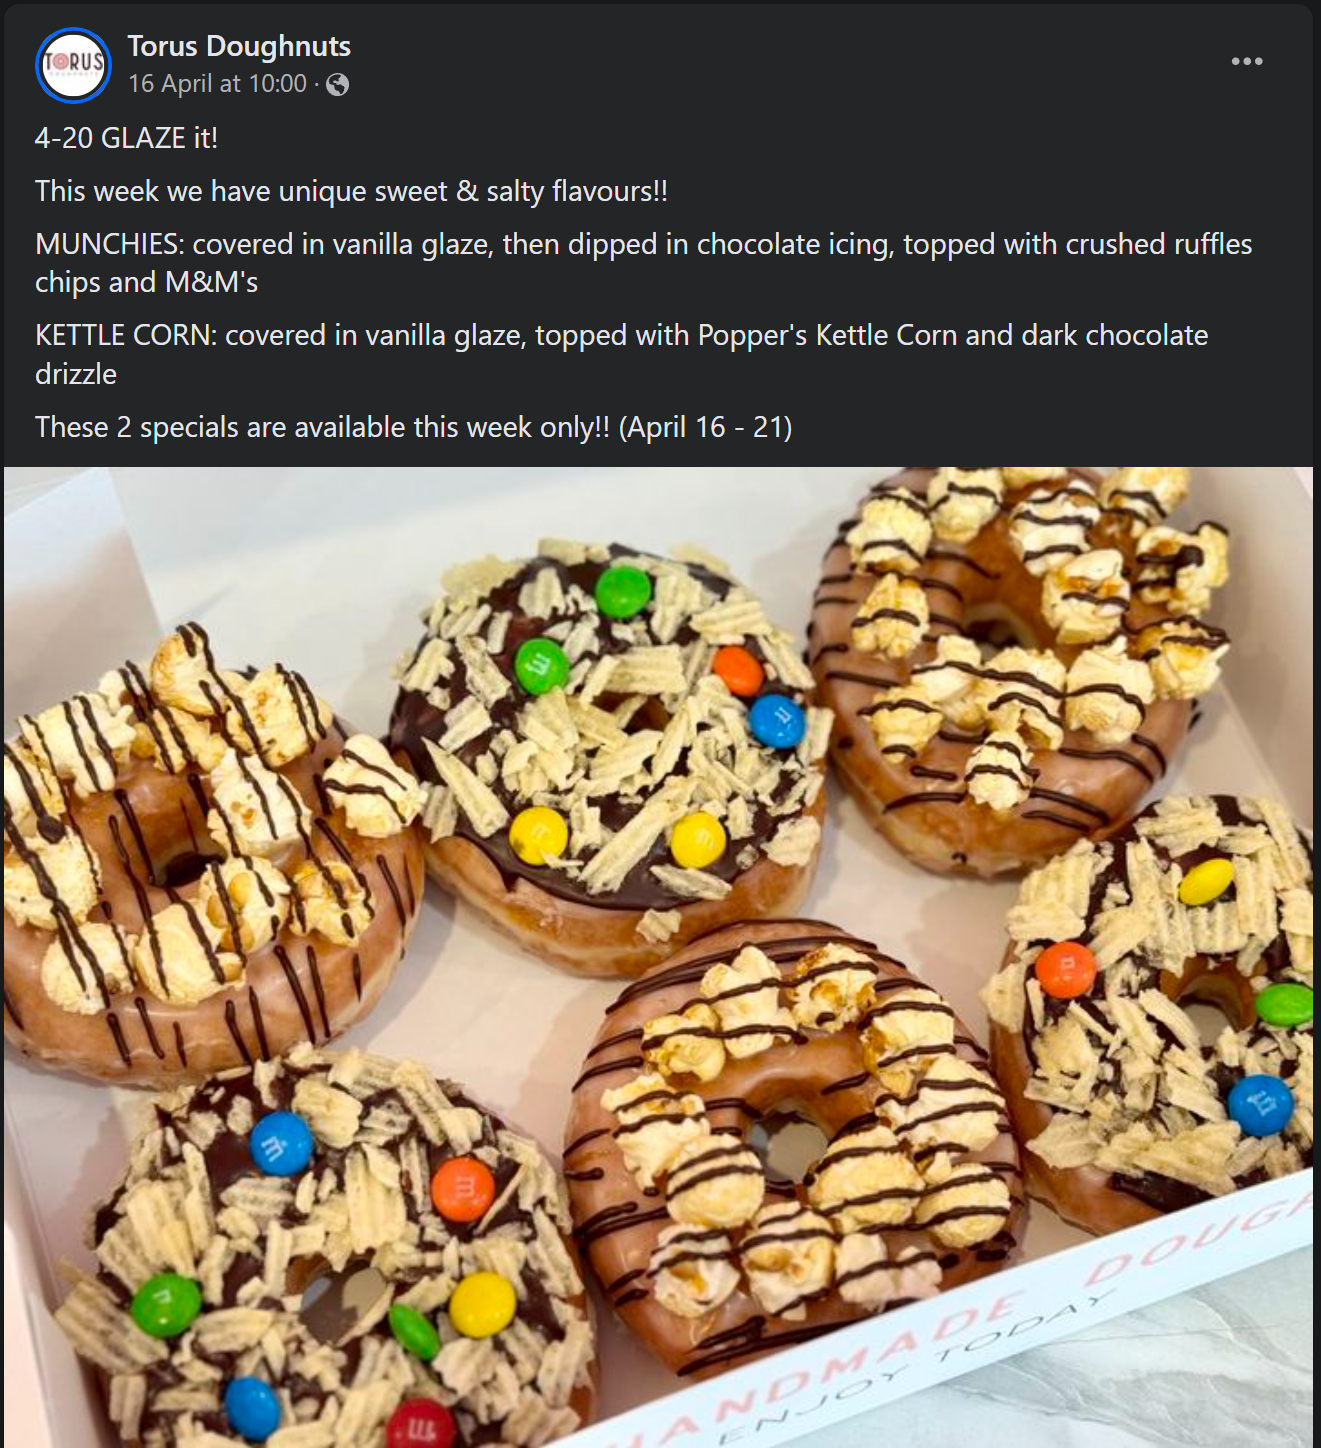
Munchie Specials
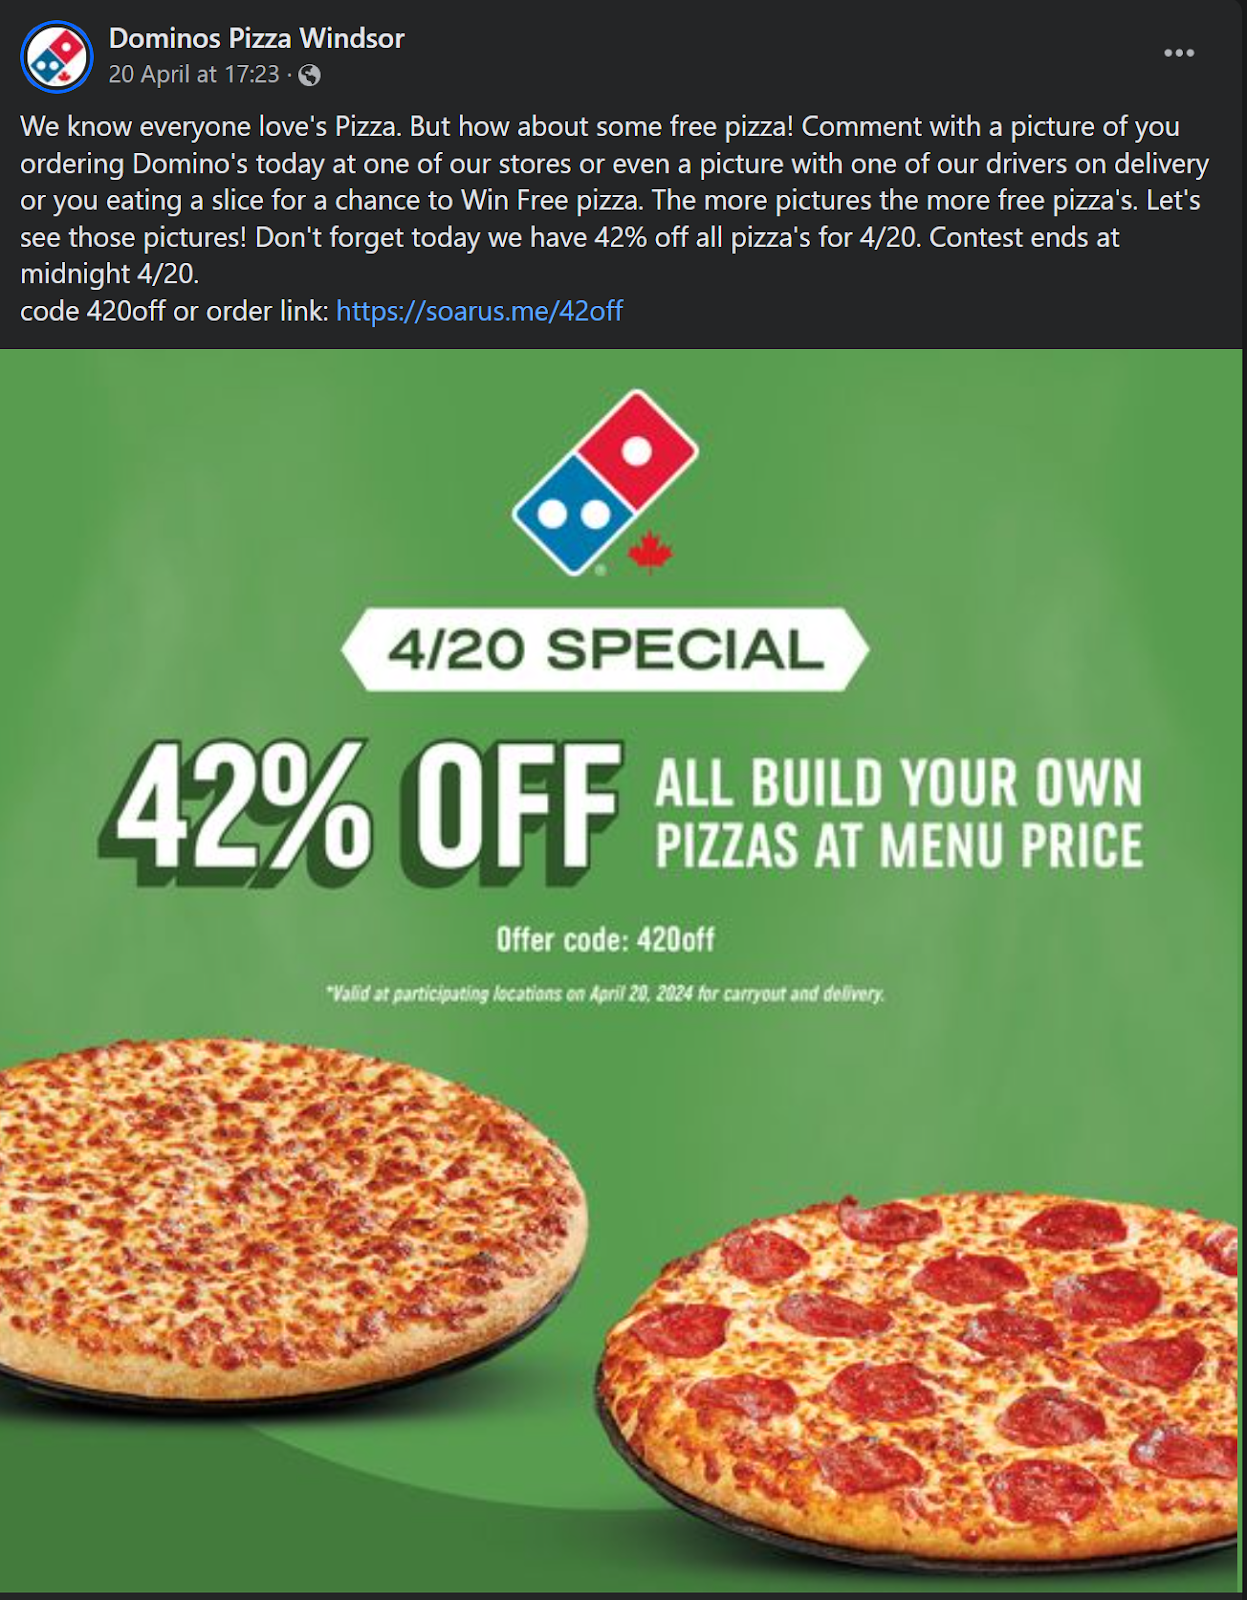
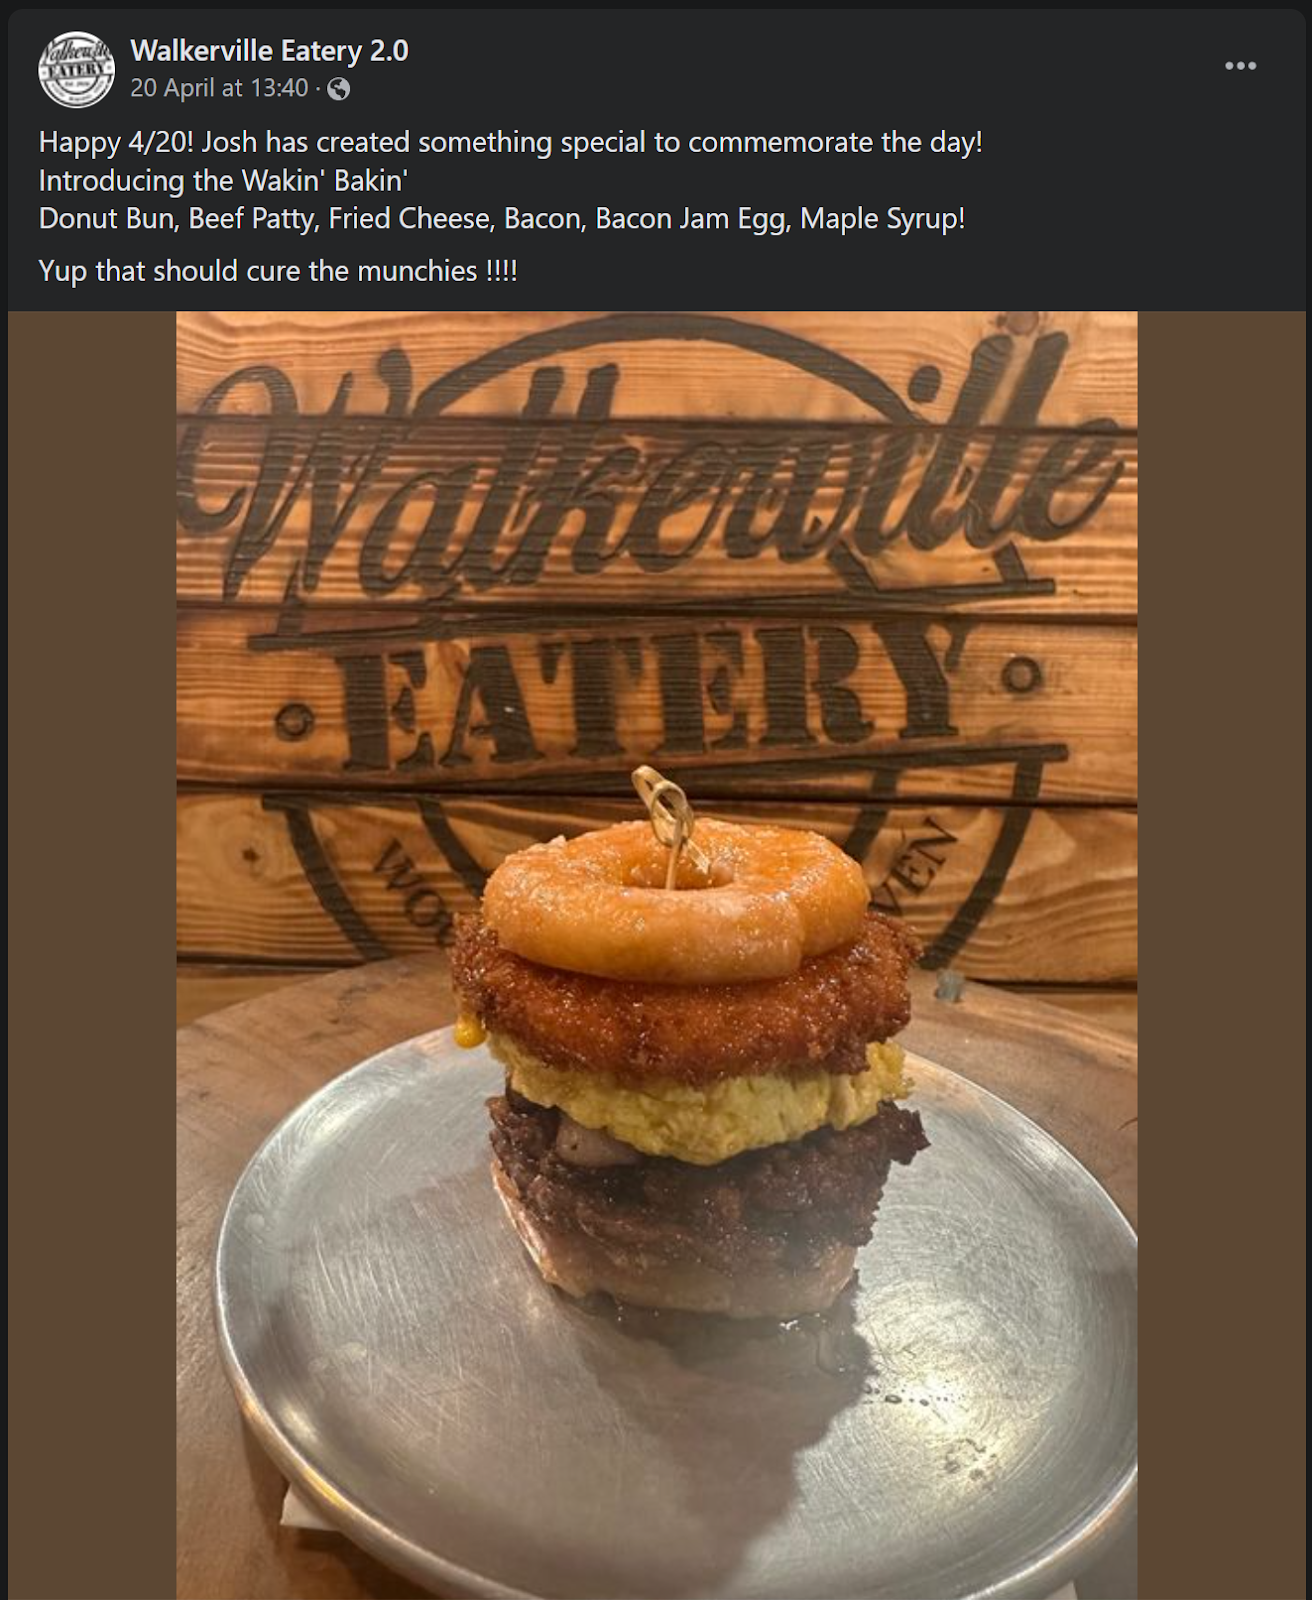
I also did some digging into what local restaurants had specials for 4/20. Digging through 40 local restaurant facebook pages I found 3 who had some sort of 4/20 special. Two are local places, while two are chains who had these specials beyond our community.
Cannabis Retail
In 2018, StatsCan launched the Cannabis Stats Hub, which has been discontinued and replaced with a page listing twelve data sets Statistics Canada publishes around Cannabis. Many of these, like the table of Cannabis consumer prices, have been discontinued since legalization.
Since legalization of Cannabis in 2018, Statistics Canada has reported an increasing number of data sets related to the production, distribution and sale of cannabis products in Canada.
Some of the currently-available data sets cover topics like prevalence of cannabis use, the value of cannabis produced in Canada, and household spending on cannabis. Besides these topics, there is plenty of detail on the retail sale of cannabis in Canada.
Retail sales are reported annually, broken down by province and type of cannabis. So far, there are two reporting years spanning 2021/22 and 2022/23. The data is provided in a number of different formats for download, including a format labeled “for database loading” which is terrific if you want to use SQL to query your data or drop it into Excel and manipulate it with pivot tables.
We did both. Here’s a screenshot of the Excel output showing sales by geography in each of the two periods. The data includes a summary value for all types of cannabis, so you have to be careful to filter out that value (or all other values) to get a valid result.
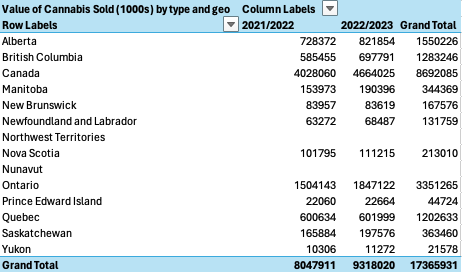
You might notice that retail cannabis sales were zero in both periods for Northwest Territories and Nunavut. Great news for Nunavut tokers – there is now a single licensed retailer in Iqaluit. The Northwest Territories now has a whopping six stores licensed for cannabis retail.
Here’s the code of a SQL query to generate a similar result, assuming you’ve loaded the data using the column names in the CSV file into a table called “CannabisSales”:
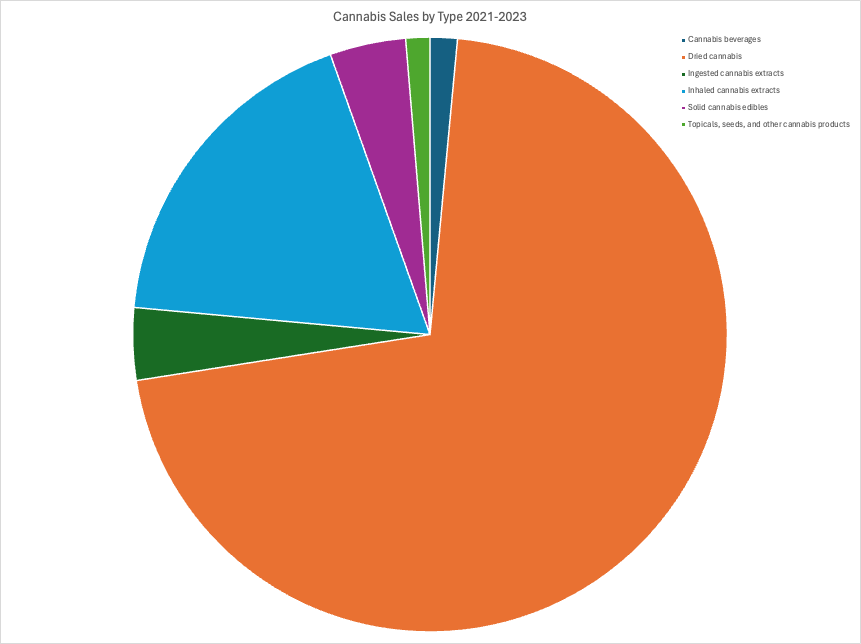
SELECT geo, Type_of_cannabis, sum(CASE WHEN ref_date = '2021/2022' THEN value2 ELSE 0 END) AS '2021/2022', sum(CASE WHEN ref_date = '2022/2023' THEN value2 ELSE 0 END) AS '2022/2023' FROM CannabisSales WHERE Type_of_cannabis <> 'Total cannabis products' GROUP BY GEO,Type_of_cannabis ORDER BY geo,Type_of_cannabisDried cannabis flower is by far the most popular type of cannabis purchased by consumers. It burns up a little over two-thirds of the dollars spent by consumers. Dried flower is followed by inhaled cannabis extracts, which are more commonly known as vaping products. They’re another 22% of sales or so. Edibles are notable among the “long tail” types of cannabis, eating up just under 5% of the market.
Statistics Canada also produces a data set breaking down the Net income of cannabis authorities, along with associated government revenues. In 2021/2022, governments realized about $1.2 billion in excise taxes, provincial sales taxes, GST and other revenues. In the following period that number was just under $1.5 billion, while retailers’ net income landed just under $2 billion – a healthy growth in sales and government revenue! This data is offered broken down by province and territory as well, if you want to drill down further geographically.
Cannabis sales are regulated provincially, so information about retail stores is provided at the provincial level. In Ontario, the AGCO’s data inventory contains a few data sets on the cannabis retail license lottery program and data on which municipalities opted in and which opted out of cannabis retail sales.
In Ontario, the AGO maintains a web page that provides a list of license applications by application status, which is also downloadable in CSV format. If you’re curious about the subset of retailer applicants currently in their public notice period, which offers local residents an opportunity to respond to the application, you can find that information on the AGCO site as well.
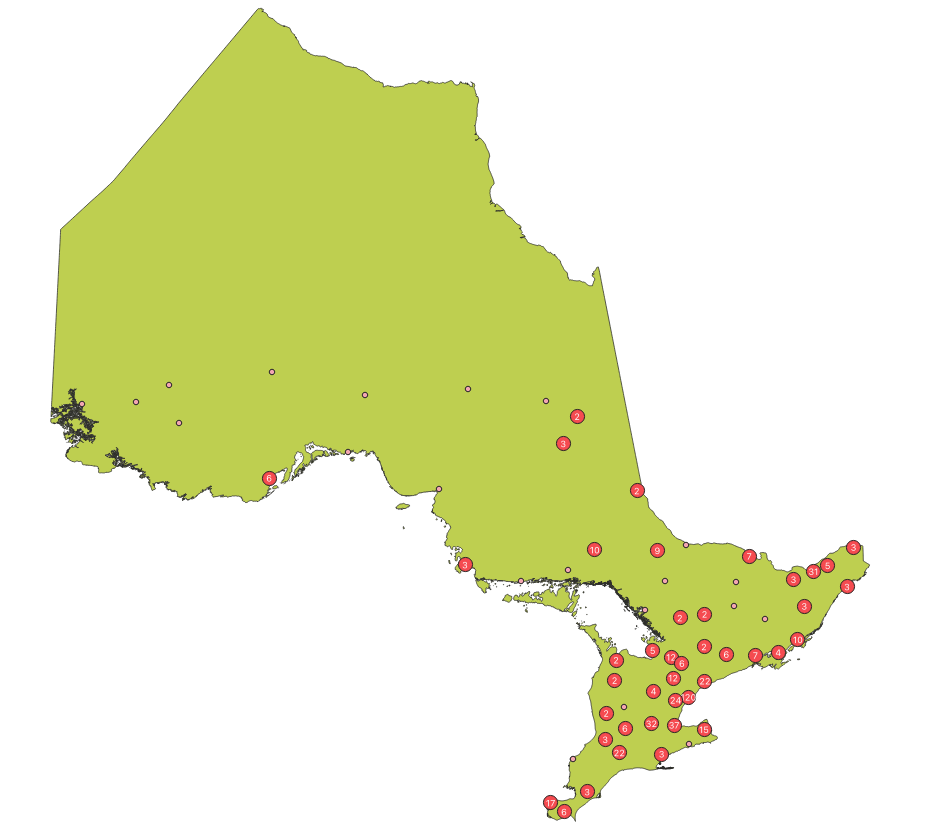
Using a handy geocoding tool, we converted this data into a list of geographic points and imported it into QGIS. It’s a bit sparse for a heat map, so we used QGIS point clustering functionality to show the number of cannabis retail outlets in a given community. You might notice an irregular line of single retail stations in Northern Ontario. That mostly follows the Trans-Canada Highway. There are only two retail stores in Ontario north of the highway.
Wackiest Tobacky Sold on Government Cannabis Websites
When cannabis was first legalized, it seemed most available products had a moderate amount of THC, with the highest percentage in the low 20s. As your average Canadian began their foray into legal cannabis, it could be safe to assume they didn’t immediately buy cannabis with the highest THC percentage they could find. Now, it seems the Canadian customer has been demanding wackier tobacky than in that first year or two, with higher and higher THC levels reaching into the upper 30 percent. To see just how wacky the tobacky gets in each province, we took a look at the government cannabis website in each province (as available!). Immediately on diving into this manual data scraping adventure, we learned there’s no government cannabis website in Alberta, Manitoba, Nunavut, Saskatchewan, or the Yukon, so those are excluded from this analysis. Additionally, while BC, PEI, and Quebec have government cannabis websites, there’s no option to sort by THC level (perhaps an attempt to keep their residents in their right minds!?), so those too have been excluded from this analysis on the account of it being a bit too time-consuming to scroll through pages of cannabis products in search of the highest THC level. This left New Brunswick, Newfoundland, Nova Scotia, Northwest Territories, and Ontario to duke it out for the wackiest tobacky sold on their websites. To keep this analysis doable and comparable, only cannabis sold as whole dried flower was considered. See the ranking in the very fancy table below!
| Province | Name, Origin, Brand, Type | THC | CBD | Price Per Gram |
| ON | Mega Breath, ON True Fire & Co Ltd. Hybrid  | 33-39% | 0-1% | $10.06/g |
| NS | Banana Mints, NS Eastcann Indica  | 30-38% | 0-1% | $9.99/g |
| AnimalZ, NS Eastcann Indica  | 30-38% | 0-1% | $10.71/g | |
| NB | Organic Kiwi Banana Cabana, NB Eco Growers Choice Indica  | 33-37% | <1% | $13.14/g |
| NT | Gelatti Kush, QC West Island Culture Sativa  | 30-37% | 0-1% | $11.21/g |
| NL | Death Star, SK Bold Growth Indica  | 30-36% | 0-1% | $9.68/g |
The aptly named Mega Breath, sold on Ontario’s OCS and produced in Ontario, takes the cake for having the highest % THC whole dried flower product available, ringing in at a whopping 33-39% THC. This True Fire product is described as “a powerful hybrid strain with a unique and potent blend of indica and sativa. The aroma of Mega Breath is pungent and earthy with hints of pine and slight sweetness that lingers in the air. Its taste is just as impressive with a smooth and complex flavour profile that combines notes of spice, diesel and citrus.” It comes with a price tag of $10.06/g, making it a pretty sweet deal. The OCS seemed to have the most information available of the government websites, with information like grow method, grow medium, and grow lighting listed, and craft cannabis stamps on products – there was far less information available on the remaining websites.
Banana Mints and AnimalZ are next in line, each sold on Nova Scotia’s NSLC website and produced in Nova Scotia. Each are indica Eastcann products with 30-38% THC. Banana Mints has a price tag of $9.99/g, and Animal Z is priced at $10.71/g. Though very similar in type, THC, and price, Banana Mints’ flavours are listed as “kiwi, banana, and earthy”, while AnimalZ has “nutty, berry, gas” flavours (someone please explain why gas is a desirable flavour!). The NSLC website was lacking descriptions for its products, but it did mark its weed with “Proudly Nova Scotian” if it was grown in the province, and you can check local store availability too!
Cannabis New Brunswick is third up, selling Organic Kiwi Banana Cabana, an indica with 33-37% THC produced in New Brunswick by Eco Growers Choice. It’s sold for $13.14/g, with the description reading, “The experience begins with intense aromas of kiwi complemented with hints of sweet citrus. The taste and flavour of the banana is as powerful as the immediate onset – which comes through with notes of melon, honey, and pineapple. Just like a ‘Copa Cabana’, who could ask for anything more… this strain packs a punch with a strong cerebral effect, followed by a hard-hitting trance of relaxation leaving you feeling heavy headed, calm and focused to take on the night with your friends on the beach.” Sounds nice (though expensive!)! New Brunswick also had by far the coolest website, with senses like “fruit” listed for products, local store availability, and even the ability to leave reviews for products! Good job, NB.
Fourth, we have Northwest Territories’ website, Releaf, which is actually just a privately owned chain with the only delivery available in the territory, so naturally, the government has designated it as their “official” cannabis website. Sadly, it seems it is close to shutting down as it can’t get enough of the right products for delivery, or so the website reads. Gelatti Kush, a sativa produced in Quebec by West Island Culture, has the highest THC on their website with 30-37% at a cost of $11.21/g. No description or flavours available for this one.
Last is CannabisNL, with the indica Death Star product from Saskatchewan’s Bold Growth available at a price of $9.68/g and coming with 30-36% THC. It has “diesel, earthy, and pine” flavours. No descriptions available on the CannabisNL website either.
There’s no real consistency in the type or brand of cannabis with highest THC offered on each website, though they do all have less than 1% CBD! Similar price points across the board too, minus Organic Kiwi Banana Cabana’s slightly higher price. It’s interesting to see the different approaches taken by each province to the cannabis rollout since legalization, and time will tell if we keep seeing higher and higher THC products released!
Cannabis related search results on the Libraries and Archives Canada catalog
Libraries and Archives Canada maintains the catalog for Canada’s National Archives and National Libraries. Anybody can search the catalog online. We decided to do some searches for Cannabis related topics and graph them by publishing data. First up, the obvious “Cannabis” search:
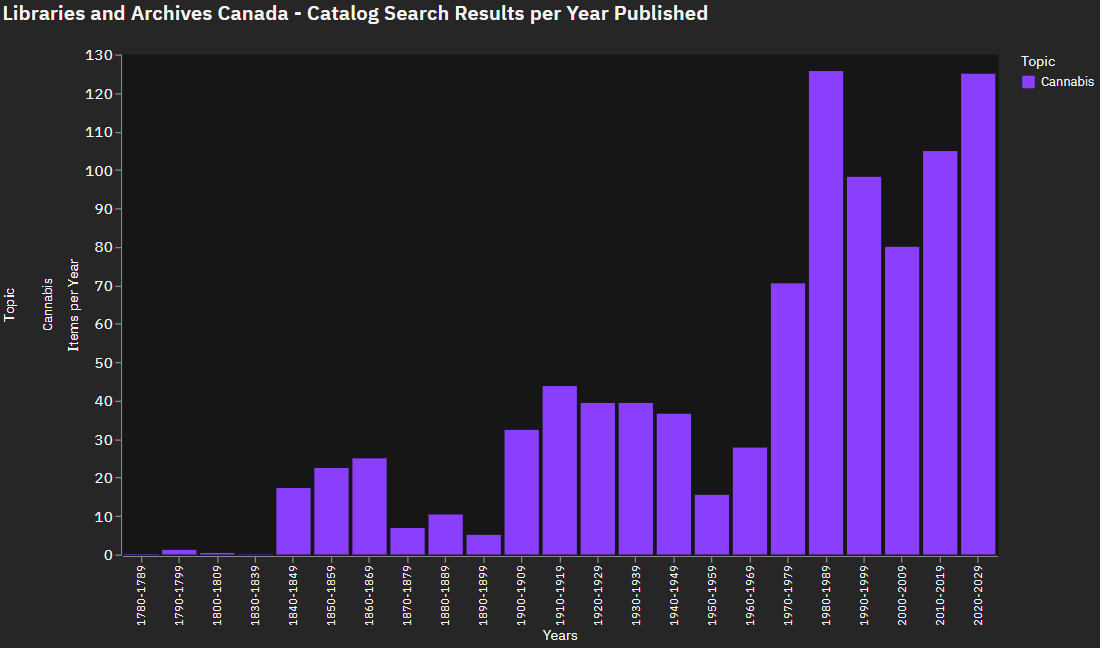
Interestingly the publications peak in the 1980’s rather than recent history, which you may expect given recent legalization. You may also think that 1780 is a little early for Canadian documents about Cannabis, and you’d be right. The lone record in the 1786 was a land petition for Lower Canada for a Mr. Benjamin Weed. Clearly archives Canada is smart enough to know “weed” is a synonym for “cannabis”, but not smart enough to know the proper name “Weed” is not – a much harder problem.
Let’s take a look at some Cannabis related cultural figures and how they’re represented in the archives:
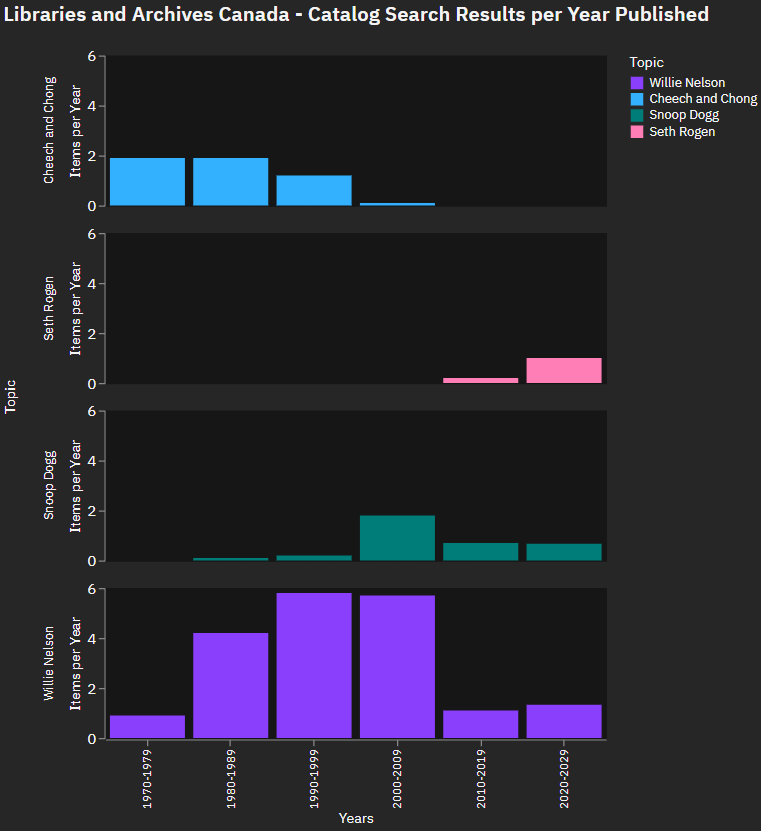
Willie Nelson by far the most popular of the four. If you’re wondering what kind of Snoop Dogg related material our national archive organization stocks, the earliest published item for the artist is a CD insert for issue 179 of a weekly UK music industry publication called “The Tip Sheet”. “Snoop’s upside ya head” appears alongside a Celine Dion’s “All by myself” and a cover of Randy Bachman’s “You ain’t seen nothing yet” by an artist known as Loverman on the insert. Strangely, issue 179 appears to be the only issue of “The Tip Sheet” stocked by Library and Archives Canada.
10 قسمت


